This article appeared in Africa Review and featured as 'Editor's Choice' in The Daily Nation (Kenya).
As the battle lines are drawn in the lead-up to Zambia’s 2011 election, wellwishers hoping for a pact between the two leading opposition parties - Michael Sata’s Patriotic Front (PF) and Hakaimbe Hichilema’s United Party for Democratic Development (UPDP) - surely faced the politics of disappointment when each party went their separate ways earlier this month.
Read more....
Thursday, December 2, 2010
Friday, November 19, 2010
Can CCM sustain stranglehold on power?
This is a link to my article featured in Africa Review
Tanzania’s fourth multiparty elections were, in some ways, not significantly different from the first three, held in 1995, 2000 and 2005.
Tanzania’s fourth multiparty elections were, in some ways, not significantly different from the first three, held in 1995, 2000 and 2005.
Just like before, the long-time ruling party, the Chama Cha Mapinduzi (CCM).....
Read more....
Update: a longer version is also posted at Pambazuka.
Wednesday, November 10, 2010
Take Action and Help Stop Bush Tax Cuts for the Richest 2%!
As all of you know, as the sun sets on the Democrat controlled House, one of the dominant issues is the possible extension of the Bush tax cuts, primarily those cuts that specifically target the country’s highest income earners. As all of you also know, taxes levied on the wealthiest Americans are at an all-time low, while the deficit is rising, along with income inequality and America’s entry into the Banana Republic club (seriously).
Just as I did during health care reform efforts, I now take the liberty of posting some key tax cut tweets here. You may have already seen them floating around on “#p2” and “p2b”. Please, get the word out by tweeting them profusely and don’t waste space by crediting me. Tweet to trending hash tags if needed. Most of mine include “#Fact”, in an effort to reach an audience beyond the progressive crowd. Also, below are a few Act.ly petitions that you should also tweet and tweet and tweet. Now, for the good of our country, get to work, and happy tweeting.
Just as I did during health care reform efforts, I now take the liberty of posting some key tax cut tweets here. You may have already seen them floating around on “#p2” and “p2b”. Please, get the word out by tweeting them profusely and don’t waste space by crediting me. Tweet to trending hash tags if needed. Most of mine include “#Fact”, in an effort to reach an audience beyond the progressive crowd. Also, below are a few Act.ly petitions that you should also tweet and tweet and tweet. Now, for the good of our country, get to work, and happy tweeting.
Petitions
Top 1% getting 65% of GDP!! Hey Rep @jahimes! With windfalls like this, who needs a tax break? http://act.ly/2ew RT2Sign #p2 #p21
Top 1% getting 65% of GDP!! Hey Sen @evanbayh! With windfalls like this, who needs a tax break? http://act.ly/28u #p2 #p21
Top 1% getting 65% of GDP!! Hey @Rep_Giffords! With windfalls like this, who needs a tax break? http://act.ly/2fg RT2Sign #p2 #p21
Top 1% getting 65% of GDP!! Hey @repschrader! With windfalls like this, who needs a tax break? http://act.ly/2fh RT to sign #p2 #p21
Top 1% getting 65% of GDP!! Hey Rep @LeonardBoswell! With windfalls like this, who needs a tax break? http://act.ly/2ff RT2Sign #p2 #p21
Top 1% getting 65% of GDP!! Hey Rep @HarryEMitchell! With windfalls like this, who needs a tax break? http://act.ly/2ev RT2Sign #p2 #p21
Top 1% getting 65% of GDP!! Hey Rep @GlennNye! With windfalls like this, who needs a tax break? http://act.ly/2eu RT2Sign #p2 #p21
Top 1% getting 65% of GDP!! Hey @SenBenNelson! With windfalls like this, who needs a tax break? http://act.ly/28l RT2Sign #p2 #p21
Top 1% getting 65% of GDP!! Hey @RepJimMatheson! With windfalls like this, who needs a tax break? http://act.ly/2et RT2Sign #p2 #p21
Top 1% getting 65% of GDP!! Hey @repjohnbarrow! With windfalls like this, who needs a tax break? http://act.ly/2es RT2Sign #p2 #p21
Top 1% getting 65% of GDP!! Hey @whitehouse! With windfalls like this, who needs a tax break? http://act.ly/28l RT to sign #p2 #p21
Tweets
#Fact: Bush tax cut extensions=lowest bang 4 the buck versus 11 other stimulus plans (CBO) http://bit.ly/cRrLzd #p2 #p21
#Fact: The CBO ranked tax cut extension for the top 2% as DEAD LAST out of a range of stimulus options. #p2 #p21
#Fact: $200 billion=cost of Bush Tax cuts in 2010, $34 billion=cost of jobless benefits for 2010. #p2 #p21
#Fact: Payroll tax cut for firms hiring more workers=4 to 8 times as many jobs per $ as extending high-income tax cuts. #p21 #p2
#Fact: Every $ spent on Bush tax cut yielded a mere 32 cents in economic growth (Moody's Analytics)! #p21 #p2
#Fact: 1990s, b4 Bush tax cuts, small businesses added 756,000 jobs per year vs 367,000 during Bush years. #p21 #p2
#Fact: If Bush tax cuts expire, the high income marginal tax rate wld still be lower than it was at end of Reagan's 1st term. #p2 #p21
#Fact: Cost of the Bush tax cuts to the top 1% alone is larger than the Department of Education's budget http://bit.ly/aXCoGY #p2 #p21
#Fact: In the long-run, Bush tax cuts will be the largest contribution to the deficit! http://huff.to/9Q1BlM #p21 #p2
#Fact: Between 2002 & 2007 two-thirds of the nation’s total income gains flowed to the top 1% of households. #p21 #p2
Sources
Posting sources is difficult to do, given the 140 character limit. In case someone asks, here are the sources for these tweets. If it's a teabagger asking, blow their minds and tell them that all data is from Glenn Beck. After all, for them, any other source is just a hub in the Obama/Chavez/Marx/Kim Jong Il communist nexus of tyranny based in Kenya.
Tweet #1 includes a link (http://bit.ly/cRrLzd) that covers tweets #2,
Tweet #3 http://nyti.ms/bSNCHU
Tweet #4 http://bit.ly/cTILeH
Tweet #5 - http://usat.ly/9hzP4u. This could also cover tweets #1 and #2
Tweet #6: http://bit.ly/cTILeH
Tweet #7 - is actually a quote from http://huff.to/cggxdb
Tweets #8, 9 include links
Tweet #10 http://bit.ly/ao5fTU
As far as the petitions go, the 65% figure is an adjustment made to an article (http://yhoo.it/dcCSJJ)that says 66%. I remember the number being 65%, so I errored on the side of caution.
Hope this helps. I try to keep these sources in order, but I literally have hundreds (maybe several thousand) tweets across a couple of different spread sheets.
Thursday, November 4, 2010
How Does Political Participation in Tanzania Stack Up?
I’ve often heard the claim that Tanzanians are, politically speaking, relatively apathetic – the corruption and moral decay that has accompanied the CCM’s rule (especially since the 1980s) leads people to shun politics. While I’d certainly say that, given then revolving door between the CCM and big money in Tanzania’s politics, people might have every reason for being apathetic, some of the empirical data simply fails to measure up to the claim about apathy.
Currently, I’m doing a bit of academic research for a paper exploring the relationship between political competition and political participation throughout Africa. The work is still somewhat preliminary. However, given the energies around the recent election, I thought I’d share - in a casual blog post - some of the more interesting pieces of data on political participation in Tanzania.
The data in the tables below are frequency distributions based on data obtained from Afrobarometer. For those of you less familiar with this data, Afrobarometer surveys are complied by a network of 23 research partners and supporting units in 21 different countries and are rich sources for social, political, and economic data from standardised surveys taken from 19 African countries since 1999. Each table contains a statistical summary of the respondent answers to some of the survey questions related to political participation. Also, for those who might be less familiar with statistics terminology, the “percentile” categories are nothing more than rankings. So, a percentile score of “100” is the highest, while “0” is the lowest.
The data in table one tabulates the responses to a question about the inclination of people to talk with family and friends about politics. As the data shows, respondents from Madagascar are the least likely to engage in conversation about political matters, while Senegalese respondents are the most likely to engage. However, Tanzanians are not far behind Senegal’s citizens. A full 32.2% of the Tanzanian respondents reported “frequently” engaging in political discussions with family and friends – the second highest percentile ranking (94.10%).
TABLE 1 (Click for larger image)

Table 2 tells a similar story, but this time the question is about one’s interest in public affairs. Again, Tanzanians stand out as some of the most likely to take an interest, while the Senegalese now rank in the middle. Some 45.7% of the Tanzanian respondents reported a “very” strong interest in public affairs, second in ranking only to Lesotho.
TABLE 2 (Click for larger image)

The next table I find especially interesting. It tabulates the responses to the question asking about the participation in demonstrations or protests. Again, those respondents from Madagascar turnout to be the least inclined to engage in protests, while Tanzanians are the most inclined to “often” engage in demonstrations or protests and one of the least inclined “never” participate.
TABLE 3 (Click for larger image)

Of course, this data should be taken with an understanding of all the caveats of survey research. Moreover, I'm not at this point offering any explanations for why the participation rates for Tanzanians are so high. Maybe Tanzanians have more to complain about, although I suspect that Nigerians might be insulted by this claim. What is true is that, during single-party rule under Nyerere's leadership, political participation was not only accepted, but expected, in contrast to politics in places like Kenya and even Botswana, where participation has never been something sought after by political leaders. Whatever the case might be, the data here should, at the very least, bring pause to the claim about political apathy in Tanzania without an understanding of how political participation in the United Republic stacks up to other African countries.
Thursday, October 28, 2010
Fracking: Taking Pennsylvania by Storm
I’m relatively new to the world of hydraulic fracturing, or fracking as it’s more commonly understood. While I’ve, for some time now, been aware of the mining procedure that uses highly pressurized and chemically laden water for extracting underground pockets of oil and gas, my recent summer trip to Pennsylvania’s Lycoming and Clinton counties came with a first-hand encounter with what were soon-to-be fracking sites. Born and raised in PA, I’ve long since found another place to call home. Yet, there is never a day that fails to find my heart yearning my body back to my friends and family still living there today. So, for me, the damage caused by fracking is personal.

Whether you're an environmentalist, hunter, animal rights activist, or just plain tired of industry interests driving politics, the damage done by fracking SHOULD be an issue that unites us all. Fracking’s human and environmental casualties include toxic and highly flammable drinking water, bubbling rivers best reserved for science fiction stories, and massive water consumption tabs. Even at an untrained glance, these casualties seem as the obvious consequences of a process that injects into the earth millions of gallons of water, mixed with diesel fuel, benzene, hydrochloric acid, ethylene glycol and many more nefarious substances, with enough pressure to fracturing shale formations, only to releases natural gas in underground regions close to water our tables. Much of the damage is also caused by poor regulation. For example, while subject to negotiation, PA oil and gas mines can be drilled as close as 100 feet from a stream or wetland and 200 feet from a house. PA state law requires operators to “restore” land within nine months of drilling completion. However, little is actually known about the total costs incurred by the environment due to fracking and most of the known damage cannot possibly be restored in this period.
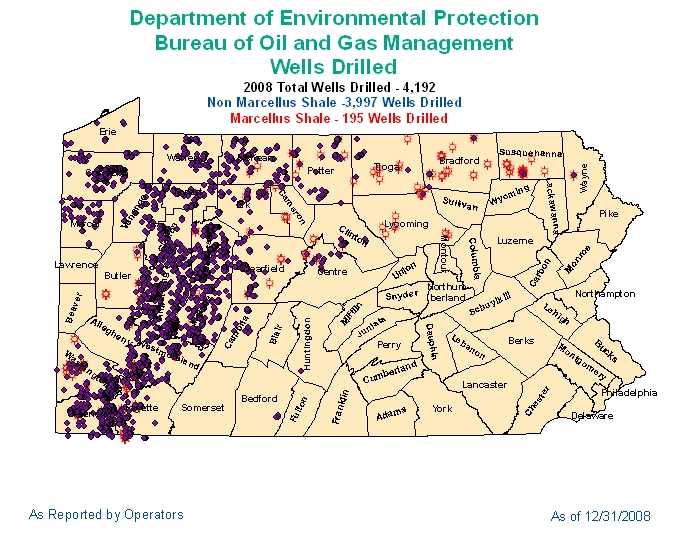
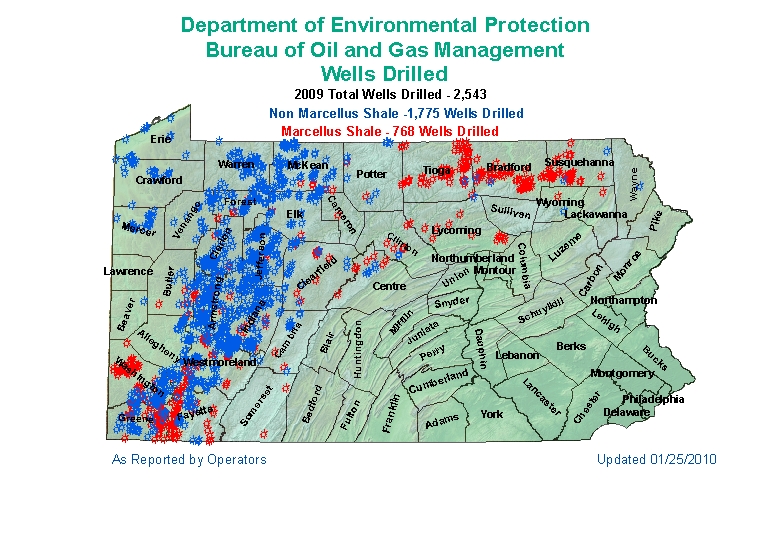
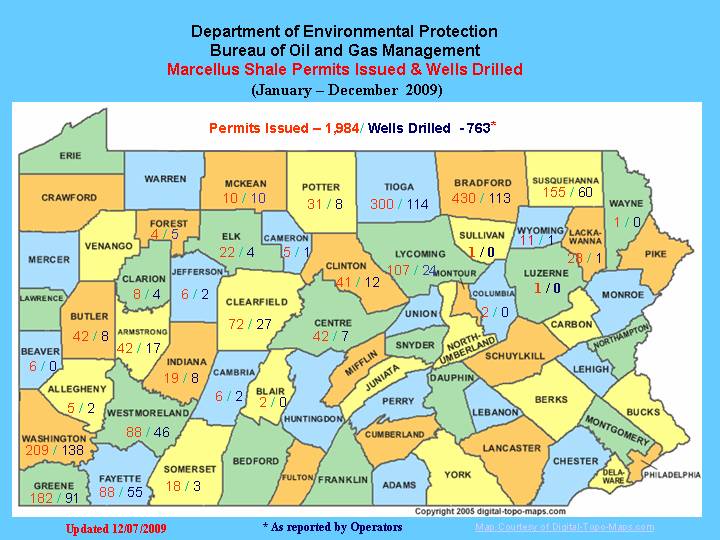
Aside fro m the executive order recently signed by Governor Ed Rendell that prevents further leasing of state forests for Marcellus drilling, fracking is still scheduled to take PA by storm, along with its wealth of wilderness. According to the State’s Department of Environmental Protection (DEP), some 195 Marcellus shale wells were drilled in 2008 and another 768 in 2009. So far, in 2010, 1099 wells have been drilled. As depicted in the bar chart below, in 2008 there were approximately 20 non-Marcellus wells drilled for every Marcellus well. In 2010, that ratio is close to 1 Marcellus well drilled for every non-Marcellus well. In 2009 alone, some 1,984 Marcellus drilling permits were issued. In 2010, that number rose to 2,350, with a staggering 27% of those located solely in Bradford County. In total, there are currently 74 Marcellus well operators in the state, sitting on whopping 5,591 drilling permits.
Now, keep the se numbers, along with this map, in mind as you browse through the following relatively innocuous-looking pics. These pictures were taken courtesy of my awesome parents during their more recent trip to Lycoming and Clinton counties. While these pictures depict the scale of a few isolated fracking sites, multiply this by the state-wide drilling trends or in context of this drilling site map. The captions in italics were written in an email from my Mom.
This (the next two pictures) is a site they were clearing back in August. They now have pipes laid and are getting ready to drill. The rig is not set up but they have the water and whatever else they are using stored on the site pad. These containers as well as other 18 wheeled tankers and stone trucks are hauled up the mountain by the hundreds every week. It is very hard to get people to believe how much traffic is on the roads is to see this for yourself.
Most of these containers weigh more than the roads are rated for. The companies just pay the fine and continue on. Some of the drilling rigs have been weighed at 170,000 lbs. None of these roads are rated for more than 70,000. Most are less than 20,000 rated. This is the kind of money and power these gas companies have.
The other sad part is the laws that allow the fines to be paid and they can continue on 100,000lbs over weight. This is common practice in the state of PA when big companies need to move big stuff. Just pay the fine and move on.


This is what the site pads look like. They usually cover several acres, looks like a Walmart parking lot!

These (next two) are pics of the gravel road, showing how much has been cleared for pipes. The second pic is what this road looked like before the gas drilling. I don't know if they will continue with clearing and drilling along this road or not. This road leads to another vista. We are not sure if the third vista is gone or not. Everything is so messed up we couldn't figure out where the other vistas are or were.


Another pic of land clearing and pipelines.

These next two were taken back in August on Queens Run Rd. Remember when we drove back toward (sorry, no personal names given here) camp last July and we saw the roadway being paved?
They were drilling a month later. In most of these places they reconstructed roadways or made new roads, so you can't get your bearings of where you are. For 25+ years we knew the area so well we knew every turn, now we just wonder where we are. This was such a beautiful gravel road.


The next picture is about a 7 mile part of Queens Run road that so far has not been touched by gas drillers. I really hope they do leave this alone. I would be so sad if they destroyed this beautiful piece of nature. This road follows Queens Run and any alteration to this road would be the end of this pristine stream and the wild life that surrounds it. This road has steep hills on both sides, one side straight up and one side is straight down. Sometimes you have to move downed branches or trees to pass through the road.

Next we have the drilling sites in Tiadaghton State Forest. One is currently being drilled and a lot of land cleared for pipelines. Site storage and drilling pads and future sites being cleared.

The two below are more of the same Rig. I also have one with the sign Bull Run Vista. We used to go to this vista. This site is accessed through what locals call Springer Farms. There is, was, a total of 3 vistas. I am assuming the access to the vista is destroyed and is gone forever. This was very remote and so quiet and peaceful. Now, not so much.


Subscribe to:
Posts (Atom)
